
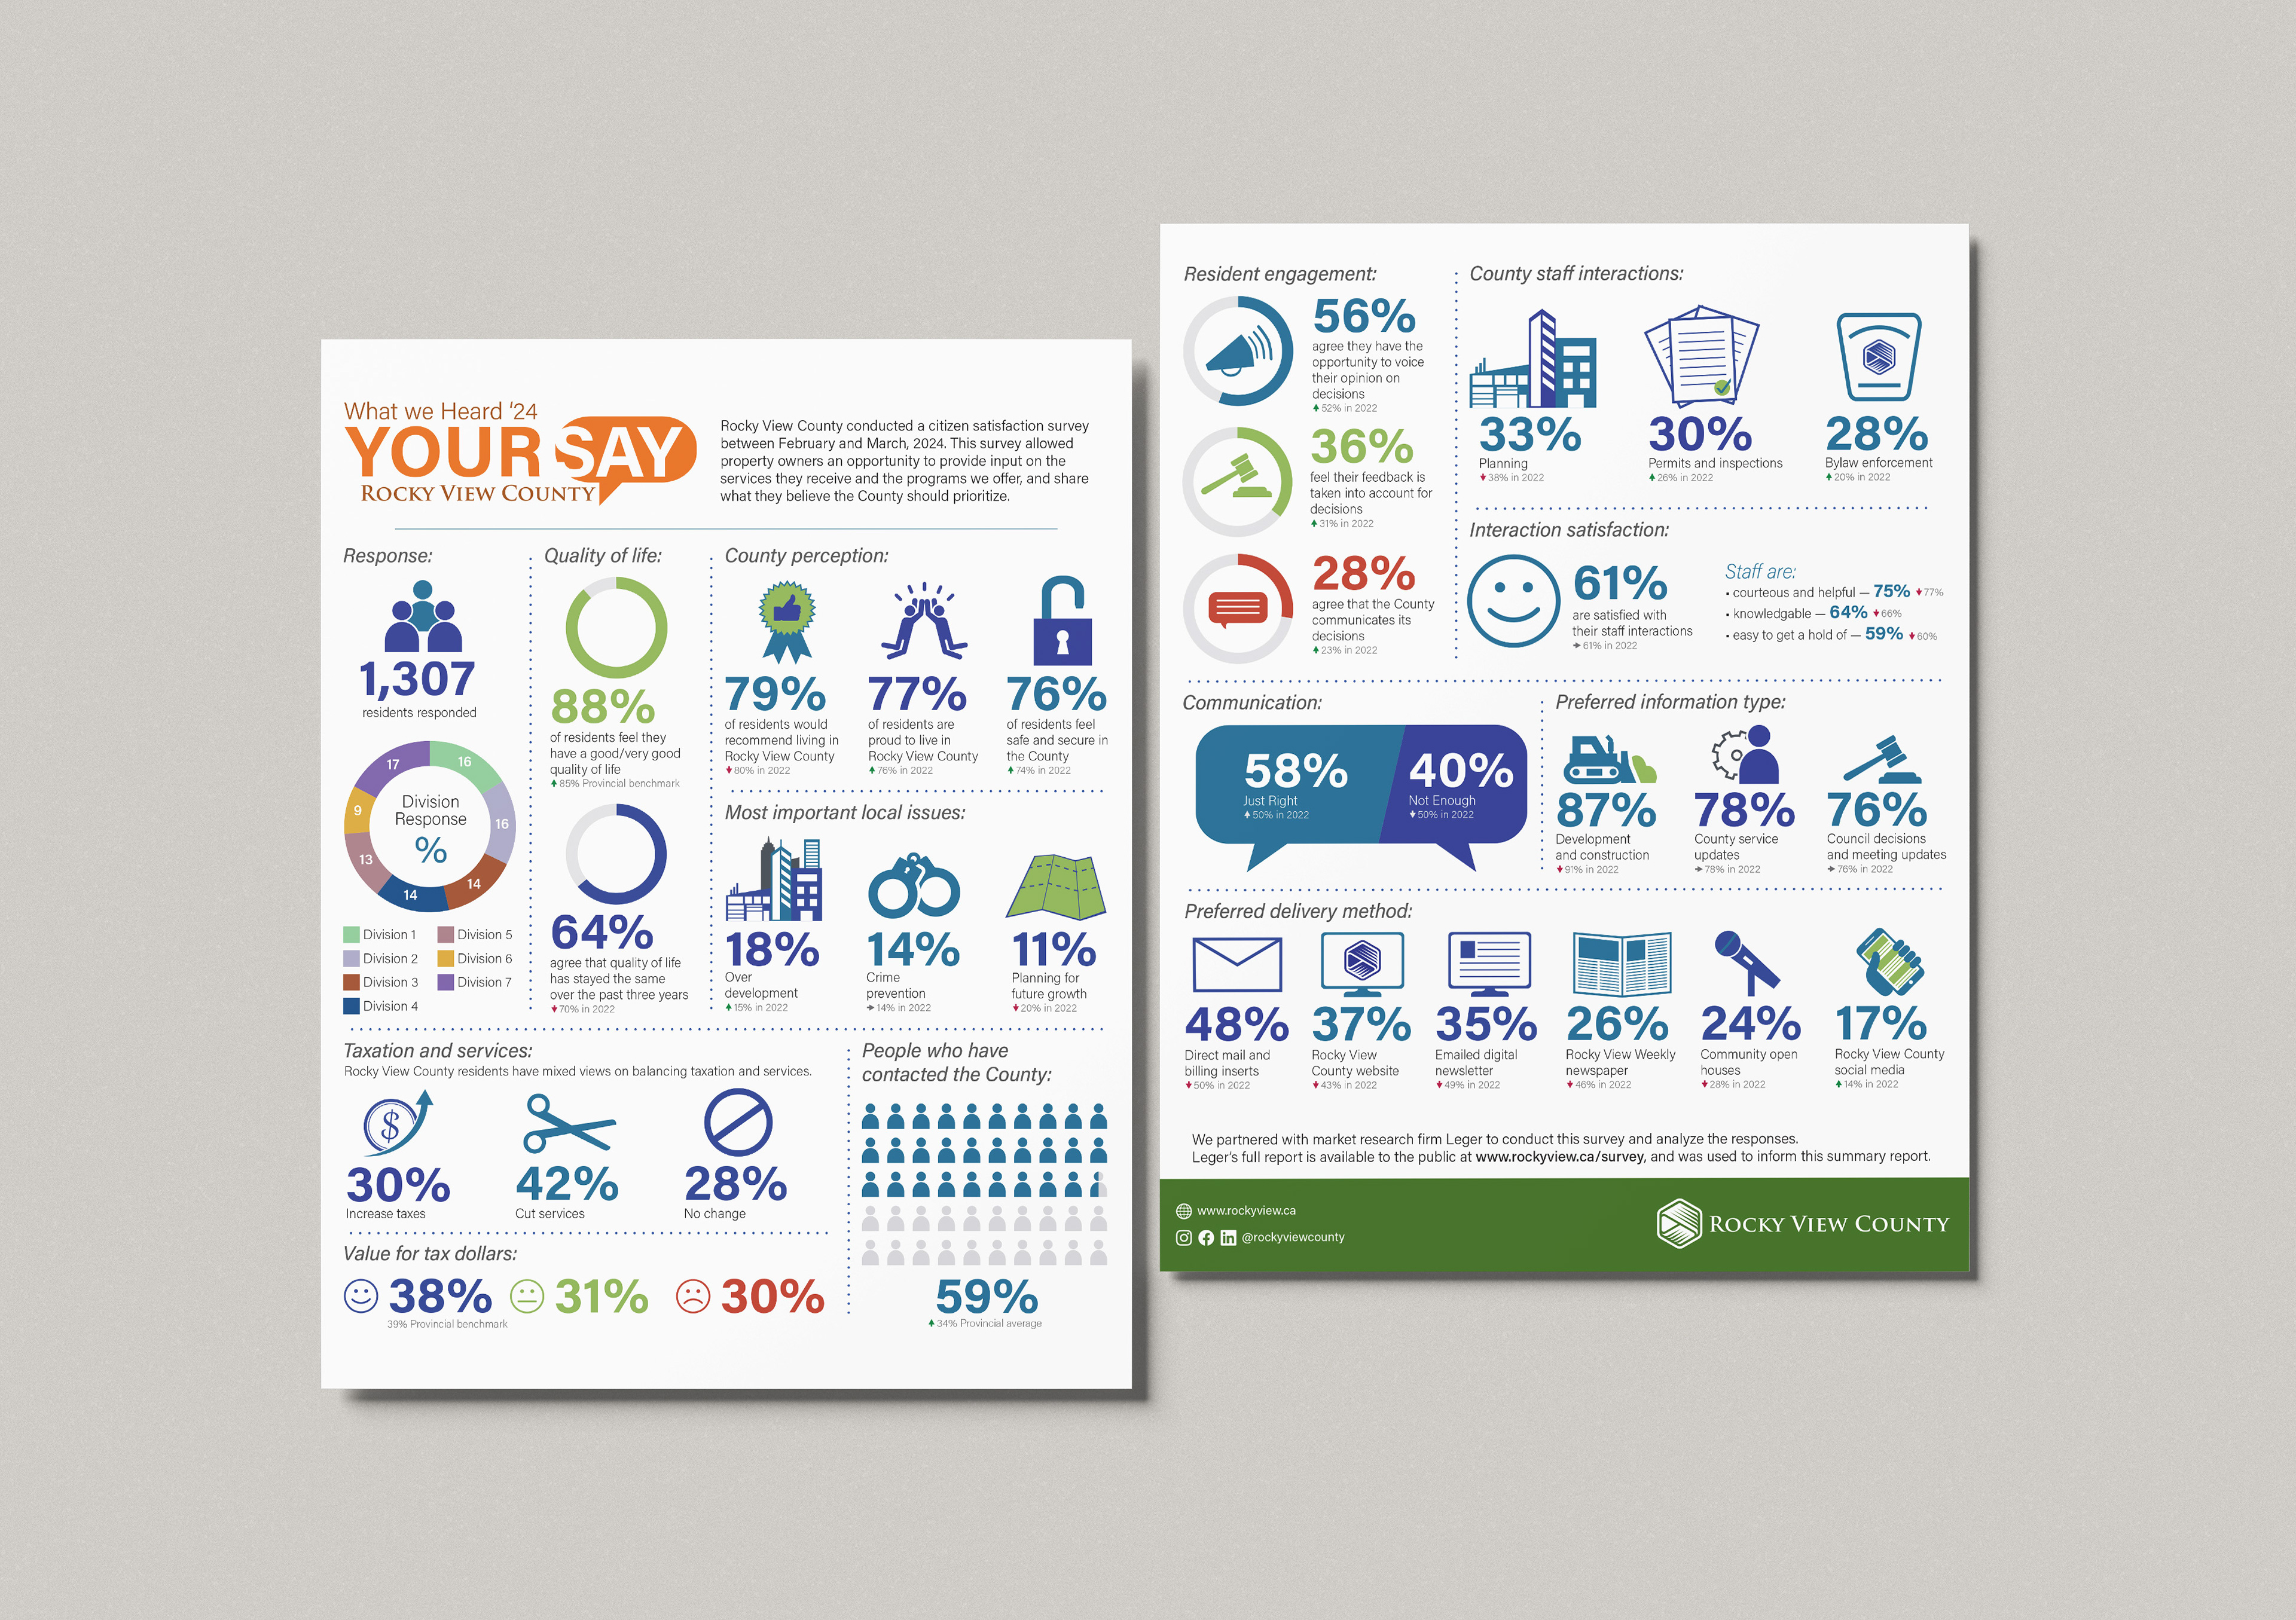
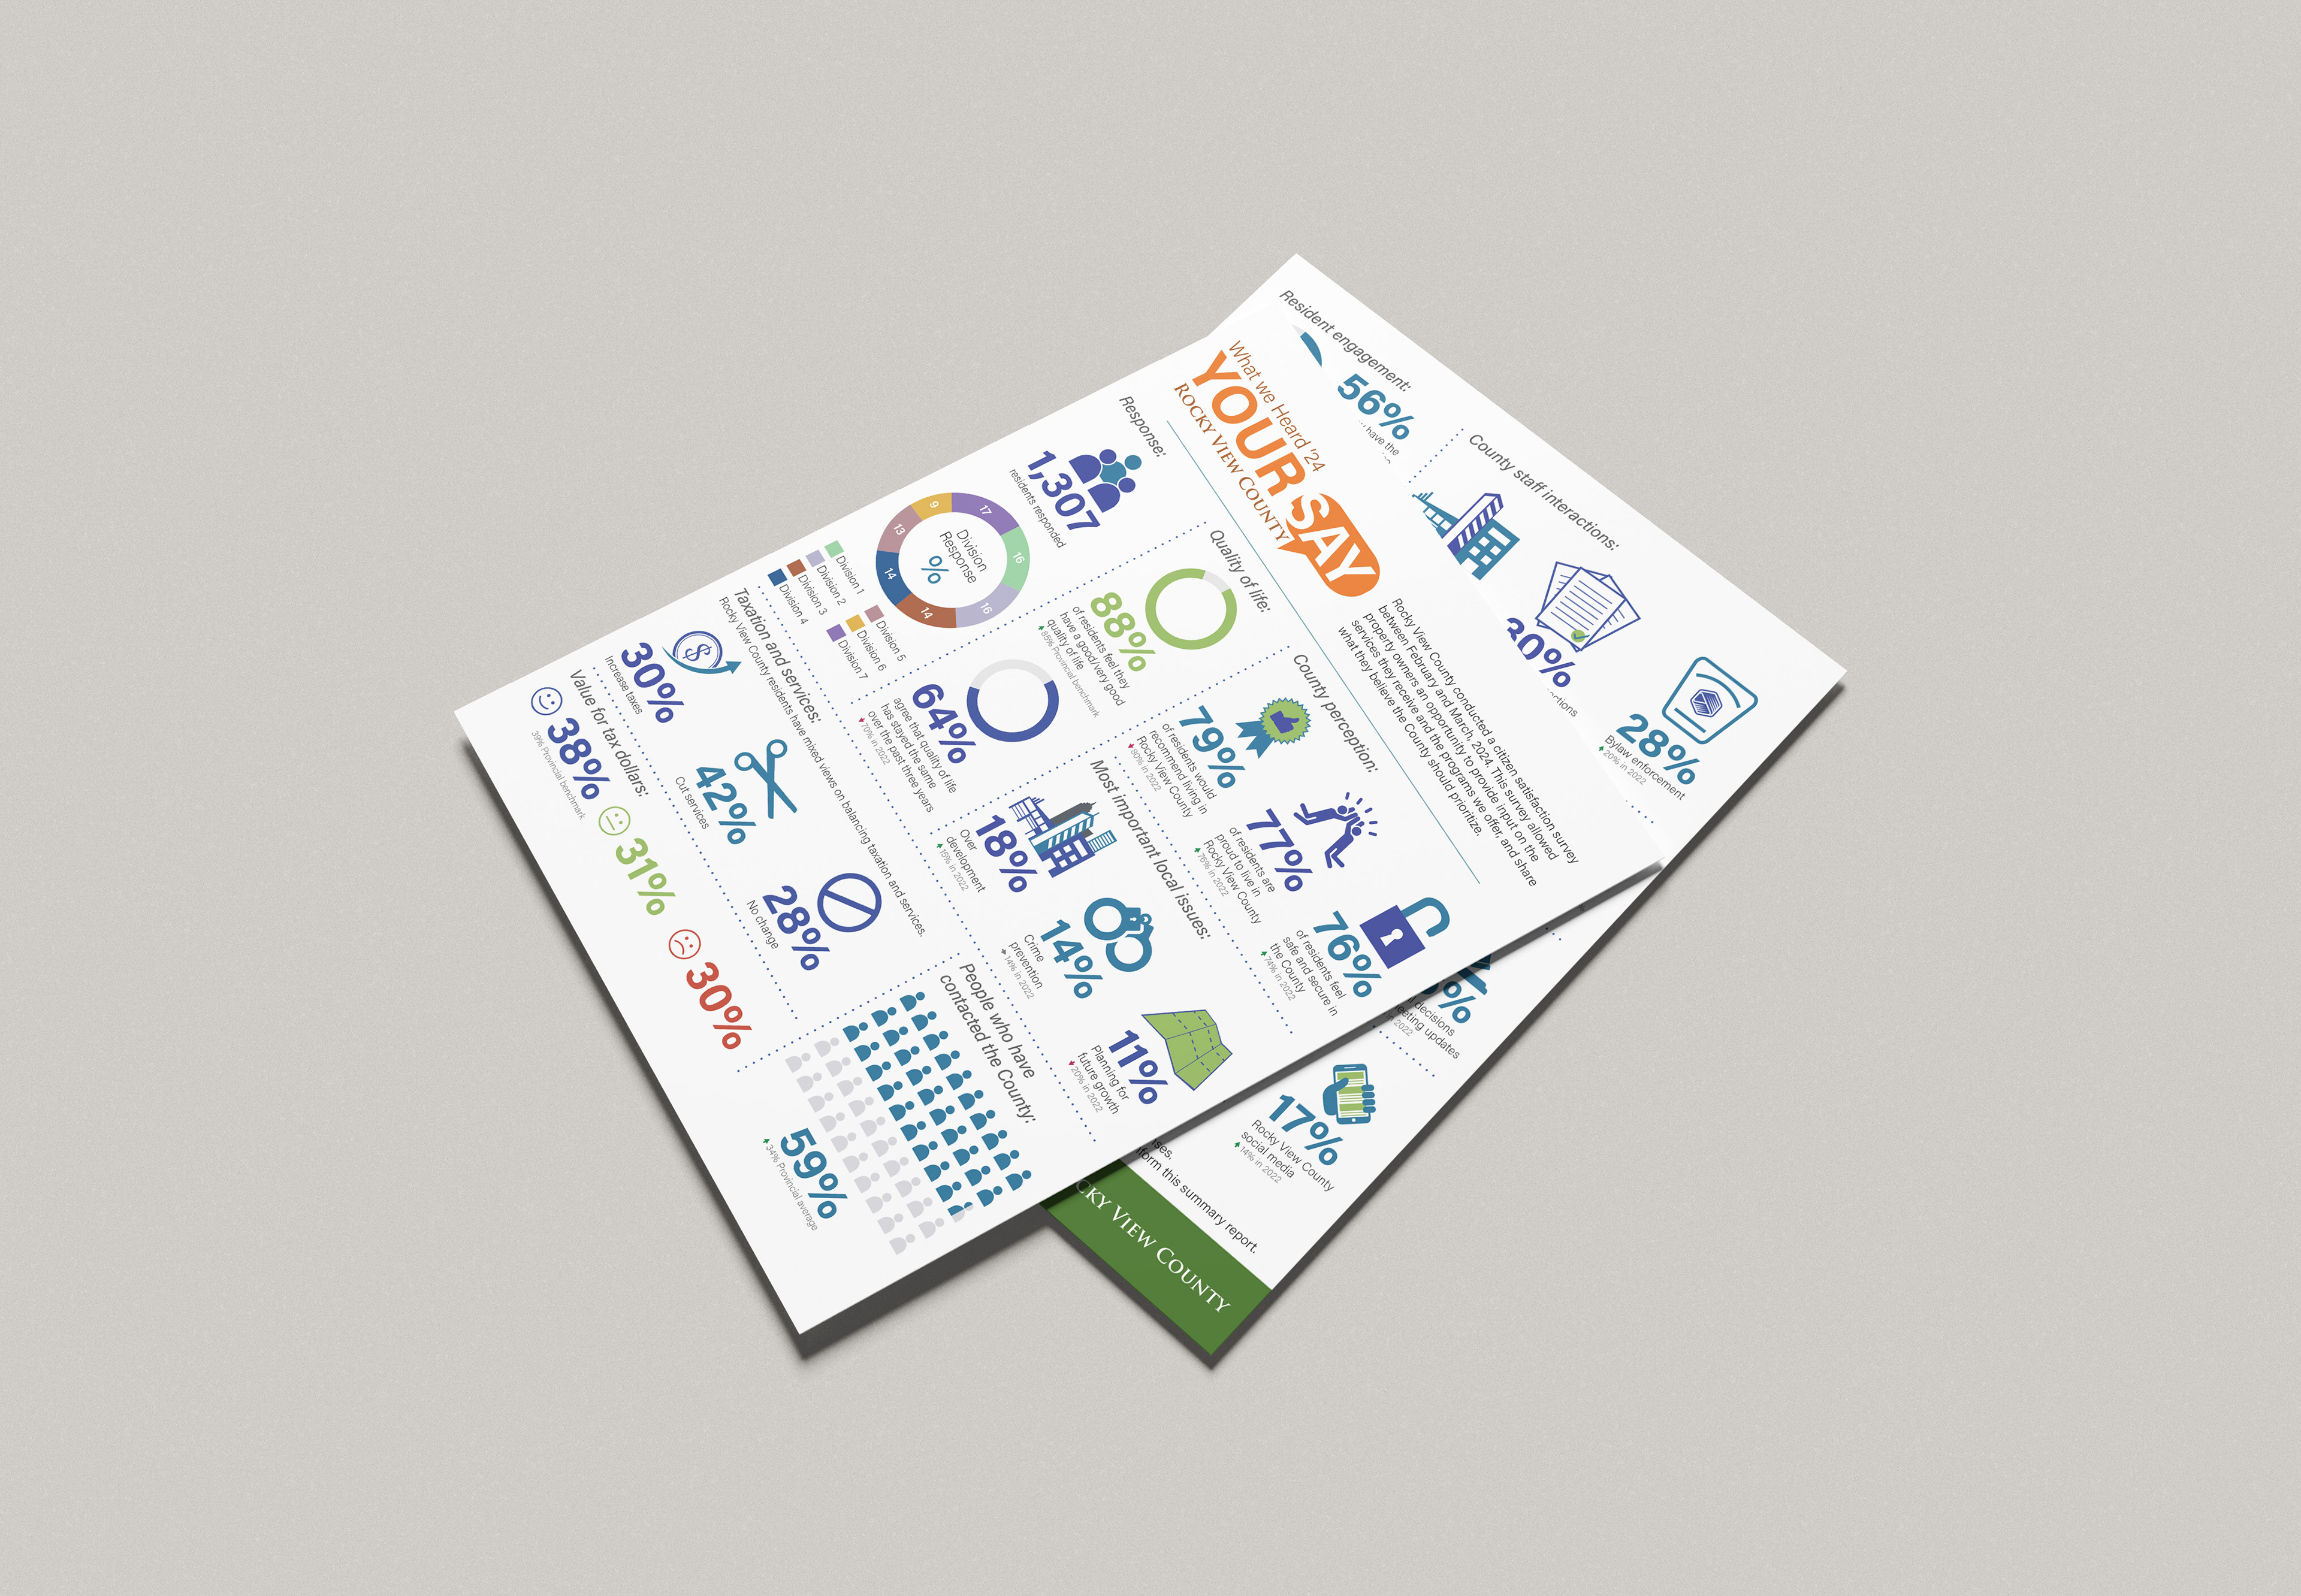
During my time employed by Rocky View County, they needed a two-page infographic to summarize its biennial Citizen Satisfaction Survey for residents and Council. Working with the Communications and Engagement team, we identified key data points from the full report and I broke them down into a clear, visual snapshot of strengths, weaknesses, and year-over-year changes.
Designed in Adobe Illustrator and following the Your Say sub-brand, the infographic used a limited colour palette and custom vector icons to keep the content clean and accessible. The main challenges were selecting the most meaningful data and organizing it into a two-page layout while keeping related topics together.
The final piece was published on the County’s website and shared through a media release to help residents quickly understand the survey’s findings.
© Rocky View County
© Rocky View County